
11 JavaScript Command Line Tricks I Wish I’d Known Sooner


Generated with flux-dev. Prompt: Generate me a water color image where there is a beige background and the red text that says: “11”
When I started working at Cresta, I learned quite a bit about NodeJS and JavaScript-related command-line techniques.
In this article, I want to share some of the things I’ve learned over the last couple of years.
1. Running Code Directly with Node’s -e Flag
The -e flag in Node allows you to execute JavaScript code directly from the command line.

2. Node’s --inspect-brk Flag for Debugging with Chrome DevTools
The --inspect-brk flag in Node enables debugging by pausing execution on the first line, allowing you to connect to Chrome DevTools for a detailed inspection.
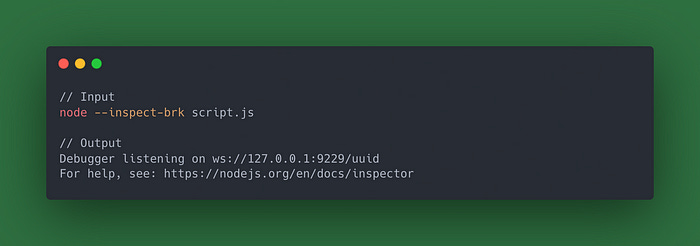
Now you can:
chrome://inspectClick on “inspect:
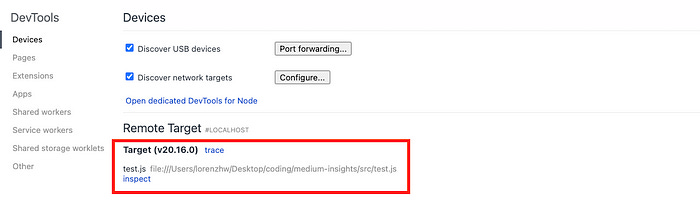
Then your dev tool window pops up and the code is paused at the first line.

This might come in handy when you debug scripts for your CI.
3. Using npx for Quick Execution
With npx, you can run local or one-off global packages without needing to install them permanently. This way you don’t clutter your global or project dependencies.
4. Using child_process for Running Shell Commands
The child_process module lets you execute shell commands directly within a JavaScript program, making it ideal for running scripts and automating tasks.

After running node script.mjs:

5. Verbose Mode with --trace-warnings
The --trace-warnings flag in Node provides detailed stack traces for warnings, which can help diagnose potential issues more effectively.
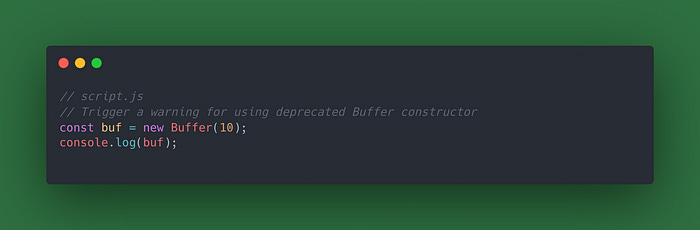
When you run node — trace-warnings script.js you’ll get a more comprehensive output with stack traces for any warnings:

Without --trace-warnings, the output is shorter and less detailed:

6. Redirecting Output to a File
Redirecting output to a file is useful when handling larger outputs or logs.

By running: node script.js > output.txt, you can save the output from console.log() directly to a file.

7. Using console.table for Neat Output
The console.table() method is ideal for displaying arrays or objects in a clean, readable table format, making debugging more intuitive than using console.log().
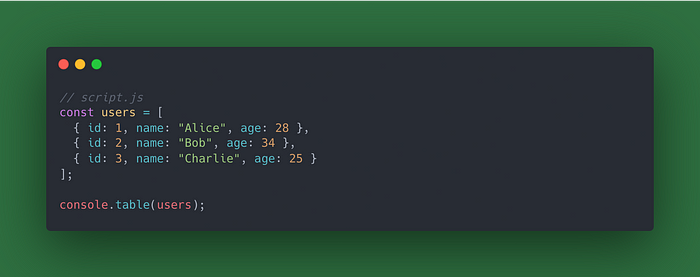
Output:

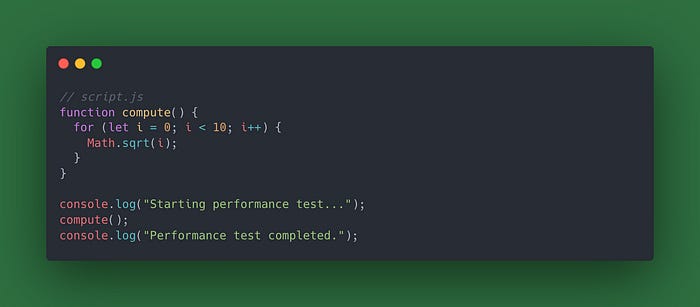
8. Logging Performance with console.time and console.timeEnd
console.time('label') and console.timeEnd('label') help measure the time taken for operations to complete, which is useful for performance insights.

Output:

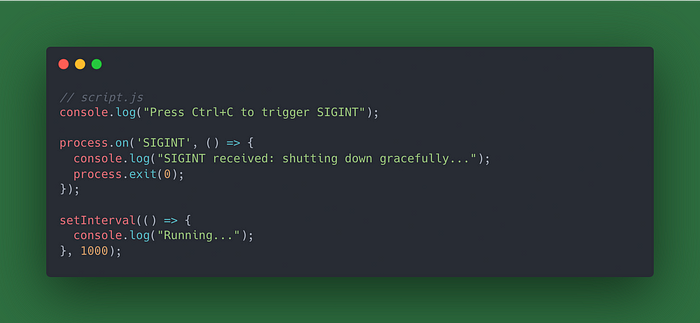
9. Handling Signals in Node (SIGINT, SIGTERM)
Use process.on('SIGINT', callback) or process.on('SIGTERM', callback) to capture signals and handle graceful shutdowns or cleanup operations when your Node application is terminated.
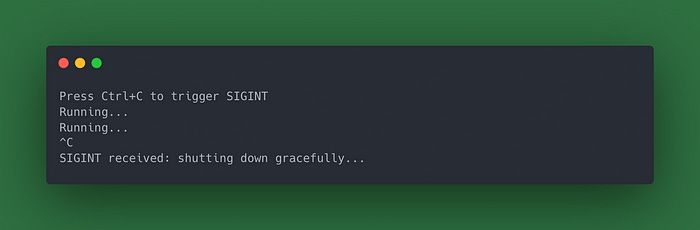
Output:
10. Generating V8 Profiler Output with --prof
The --prof flag in Node enables the V8 profiler, which generates a detailed log that can be used for performance analysis of your script.
Then:
Running
node — prof script.jswill create a log filesolate-0xXXXXXXXXXXXX-v8.logUse Node’s
--prof-processto analyze the log:node — prof-process isolate-0xXXXXXXXXXXXX-v8.log > prof-output.txt
The output file prof-output.txt will contain detailed information about function execution times and CPU usage, helping identify performance bottlenecks in your code.
11. Running Scripts in Parallel with npm-run-all
The npm-run-all package enables running multiple scripts simultaneously, which is particularly useful in CI/CD pipelines to speed up tasks like linting and testing.
Have the following defined in your package.json:

Then run npm run lint-and-test.
This command will execute the lint and test scripts in parallel, reducing overall runtime, especially helpful for CI/CD pipelines.